
Freeze frame data is a snapshot the ECU takes the moment a fault code triggers, capturing engine conditions at that exact instant. Most drivers and even some technicians pull the trouble code and ignore the freeze frame entirely, which means diagnosing the fault from incomplete information. Reading that snapshot correctly is often the difference between fixing the right thing on the first attempt and replacing parts until the light goes away.
What Freeze Frame Data Actually Is
When your vehicle’s ECU detects a condition that crosses a calibrated threshold, it logs a diagnostic trouble code and simultaneously freezes a set of operating parameters. That frozen dataset is what your scanner displays under freeze frame or snapshot, depending on the tool. The ECU captures this data because the fault condition may not be present when you connect a scanner hours or days later, but the data from the moment of failure is preserved in non-volatile memory. The parameters stored vary by manufacturer and protocol, but most OBD2-compliant vehicles capture a core set: engine RPM, vehicle speed, engine load, coolant temperature, fuel trim values (both short-term and long-term), throttle position, and the number of warm-up cycles since the fault was set. Some vehicles also store intake manifold pressure, oxygen sensor voltage, and ignition timing advance. The specific PIDs logged depend on which system set the fault. A misfire code will typically freeze ignition-related parameters, while an evaporative emission fault will capture fuel system and purge valve data. Understanding what the ECU chose to capture already tells you something about where it was looking when the problem occurred.
How to Navigate to Freeze Frame on Common Scanners
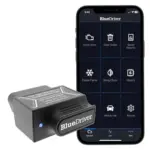
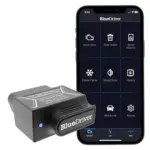
The path to freeze frame data is not consistent across scanner brands, which causes confusion even for experienced users. On most handheld scanners, you access it by first reading codes, selecting a specific code from the list, and then looking for a secondary option labeled Freeze Frame, Snapshot, or View Data. The freeze frame is code-specific, meaning the data shown is linked to the code you selected, not a global vehicle state. On app-based Bluetooth scanners, the freeze frame is usually accessible from a detail screen after tapping on an individual code. Some apps display it as a separate tab next to live data. On professional-grade scan tools with touch interfaces, freeze frame is often a button or swipe gesture within the code detail view. If your scanner shows no freeze frame option for a particular code, either the code type does not support it (mode $02 must be supported by the ECU for that fault), or the ECU cleared it after a set number of drive cycles without the fault recurring. Scanners that support real-time parameter monitoring alongside freeze frame let you compare what the engine is doing now against what it was doing when the fault triggered, which is more useful than freeze frame alone.
Interpreting the Key Parameters
Engine load percentage tells you how hard the engine was working when the fault set. A load value above 85 percent during a misfire code points toward a high-demand event, like towing or aggressive acceleration, rather than an idle or cold-start condition. That distinction changes where you start looking. Fuel trim values are among the most diagnostic parameters in the freeze frame. Short-term fuel trim (STFT) reflects immediate corrections the ECU is making, while long-term fuel trim (LTFT) reflects learned corrections over many drive cycles. An LTFT reading of plus 15 percent or higher means the ECU is consistently adding fuel to compensate for a lean condition. Paired with a specific code, this tells you the system has been running lean for some time, not just at the moment of the snapshot. A value of minus 15 percent or lower indicates the opposite. Coolant temperature at fault time tells you whether the engine was cold, warming up, or fully at operating temperature. A P0300 random misfire that sets at 40 degrees Celsius points toward a cold-start fueling or compression issue. The same code setting at 92 degrees Celsius suggests a different failure mode entirely. Vehicle speed confirms whether the fault occurred at idle, low-speed city driving, or highway speeds, which matters for diagnosing load-sensitive faults like transmission codes or variable valve timing issues.
Using Freeze Frame Alongside Other Data
Freeze frame data is most useful when treated as a starting point rather than a final answer. The snapshot tells you conditions at fault detection, but detection often lags behind the actual failure event by one or more ignition cycles, depending on the monitor’s trip requirements. Some faults require two consecutive failed trips before the code sets, which means the freeze frame may reflect the second failed event, not the first. Cross-reference the freeze frame against the DTC’s diagnostic tree. If you have a P0171 (system too lean, bank 1) with an LTFT of plus 18 percent, coolant temperature of 88 degrees Celsius, engine load of 22 percent, and vehicle speed of 0 mph, that tells you the lean condition is present at warm idle. That profile points toward a vacuum leak or low fuel pressure at idle far more specifically than the code number alone. Compare this against live data at warm idle to see if the LTFT pattern is still present (see the full-system scanner coverage guide for how multi-module data access changes this workflow on more complex vehicles). If your scanner supports graphing, plot the frozen parameter values as reference lines against current live data streams. Autel and Launch tools both support this overlay approach. The gap between frozen values and current values often shows whether the condition is intermittent or continuous, which changes the repair priority entirely. Freeze frame data read in isolation is useful. Freeze frame data read alongside live stream and pending code status is a complete diagnostic picture. Capable diagnostic scanners surface all three simultaneously, which is where scanner selection directly affects diagnostic accuracy.
Freeze frame data gives you a fixed reference point that no amount of live data observation can replicate after the fact. The fault conditions may never reproduce during a drive cycle with a scanner connected, but the snapshot the ECU captured at fault detection is already there waiting. Read the load, fuel trims, coolant temperature, and vehicle speed as a set, not as individual numbers. Pair that snapshot with live data and pending code status, and you have a diagnostic starting point that is specific, repeatable, and grounded in what the vehicle actually experienced.
Affiliate Disclosure
This post contains affiliate links. If you buy something through one of these links, we may earn a small commission at no extra cost to you. We only recommend products and services we trust. Thank you for supporting this site!